
Agile and the Theory of Constraints – Part 3: The Development Team (2)
In the last post, I asked you to put some numbers on the red (aka “rework”) arrows on the diagram. There are two ways to express these numbers; either the percentage of the time a specific path is taken, or the number of times the path is taken on average. I’ve chosen the latter because it is easier to understand. As I noted in the last post, it doesn’t help us a lot to put numbers on the blue boxes because their times vary so drastically.
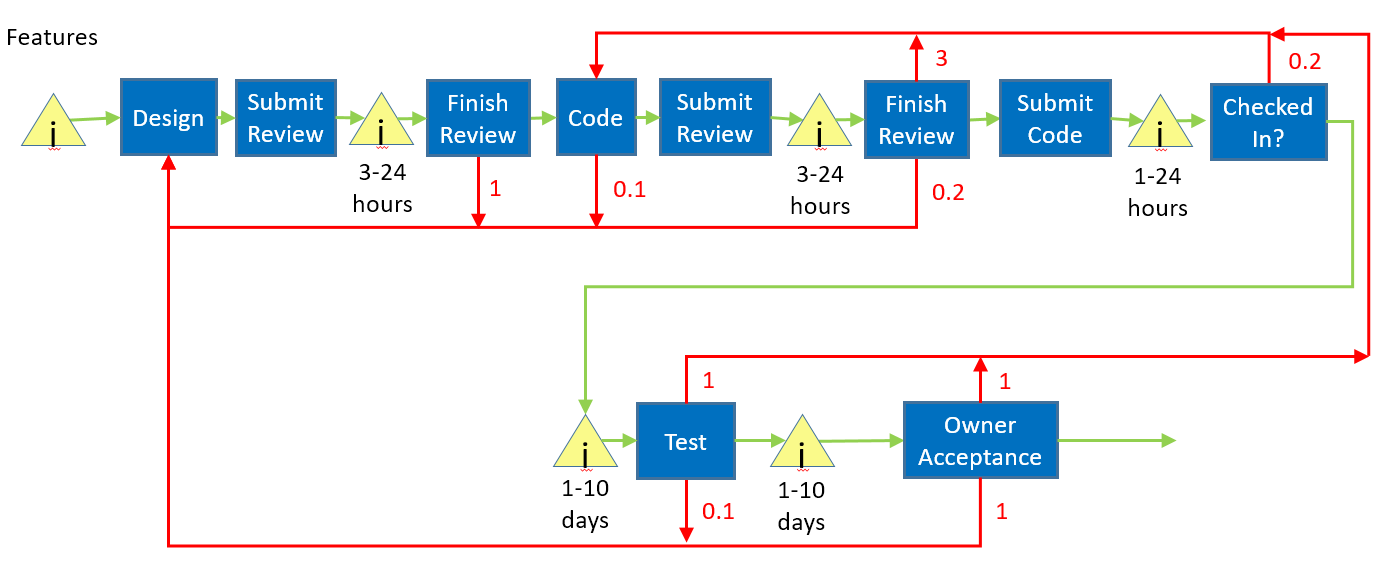
In value stream maps, we want to measure the overall time through the system. We don’t have good times for the task boxes themselves, but it’s really worse than that; pretty much every system has ways to jump queues or even skip whole sections of the process, and the numbers are different if it’s the first time through or a rework.
Does that mean this value stream map is useless?
After all the time I’ve spent writing this, I am fervently hoping the answer is “no”. Let’s see what we can do with what we have…
Searching for the bottleneck
We normally start optimization by searching for the bottleneck. Here are a few characteristics of bottlenecks:
- They are always busy.
- Work piles up in front of them.
- Downstream resources are regularly idle.
Let’s walk through these, and see how we might apply them.
- This one works well with machines, but people are another matter. Not only can we easily look busy, we might be busy with low-value work.
- Work piling up in front of them is a pretty good indicator. This is another way of saying, “examine the queues and find the ones that are the longest”.
- A machine that is after a bottleneck will look idle. As I noted in #1, humans are great at looking busy.
It looks like we will be looking at the queues.
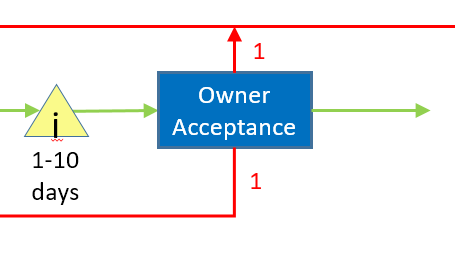
Absent any real data on where our bottleneck is, I’m going to start with the “owner acceptance” part of the process. What has drawn me here are the rework numbers, which mean that we generally find one design issue and one bug when we hit owner acceptance, which will require us to rewind back into the process. That means the owner acceptance process time for a given feature is really the sum of:
- The time spent in the incoming queue.
- The time to perform the acceptance test.
- The time spent in the “redesign” and “fix bugs” queues (queues that are absent in the current map).
- The time for the redesigned and fixed feature to wind its way through the process again.
- The time spent in the incoming queue for the second time
- The time to perform the acceptance test.
- The time to repeat steps 3-6 if the feature still isn’t right.
Not only are the rework issues slowing this feature down significantly, they are slowing all the other features down because we are using the same set of resources. And, they are significantly increasing the amount of work required in the owner acceptance step – we have to do most items twice – which is certainly going to make the acceptance testing itself slower.
Another way of looking at this is that rework causes a multiplier effect based on how often it happens and how far back in the map it sends you. Acceptance is at the end and it can send you all the way back to the beginning, so it can have a very big impact.
The solution here isn’t very surprising; we should work to a) reduce the size of the acceptance queue, so features don’t stall there, and b) reduce the chance that we need to do rework to address design issues and bugs.
There are a few agile practices that we might use:
- Embedding a product owner in the team
- Having defined and regular interaction between the product owner and the developers
- Doing feature design with the product owner and the whole team to make sure everybody is on the same page
- Writing explicit acceptance criteria for features ahead of time.
- Using ATDD with tools like Cucumber/Gherkin/Specflow.
-
The best solution is going to depend on your organization and how you structure development. I recommend focusing on a shared understanding of scenarios and acceptance criteria up front, as that will both prevent issues and streamline acceptance testing by the team.
One more thought on this area; the situation here is an example of an handoff between teams. Handoffs are a great place to look for waste, because:
- They aren’t under one team’s control, which means it would take cross-team effort – which most companies are poor at – to improve them
- The incentives in place are usually on a per-team basis, and therefore they reinforce an “us vs. them” perspective.
- Politics often show up.
- There are often fixed contracts/SLAs
In other words, it’s a lot of effort to try to fix them from within a team and the success rate isn’t great, so they persist. In lean terms, the teams on both sides will consider the handoff to be a constraint, and will subordinate (ie de-optimize) the rest of their process to try to deal with it as best they can.
It is therefore very important to ask, “what would happen if this handoff did not exist?”
Moving upstream
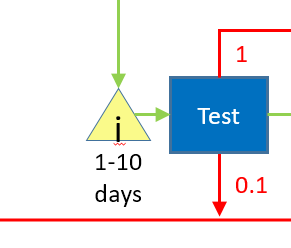
Moving upstream, we next come to the test box. It has a lot in common with the owner acceptance scenario, but in thinking about it I realized that I’m missing some important detail in the drawing. For sake of discussion, I’ve collapsed the whole upper part of the diagram into a simple “Design & Code” box.
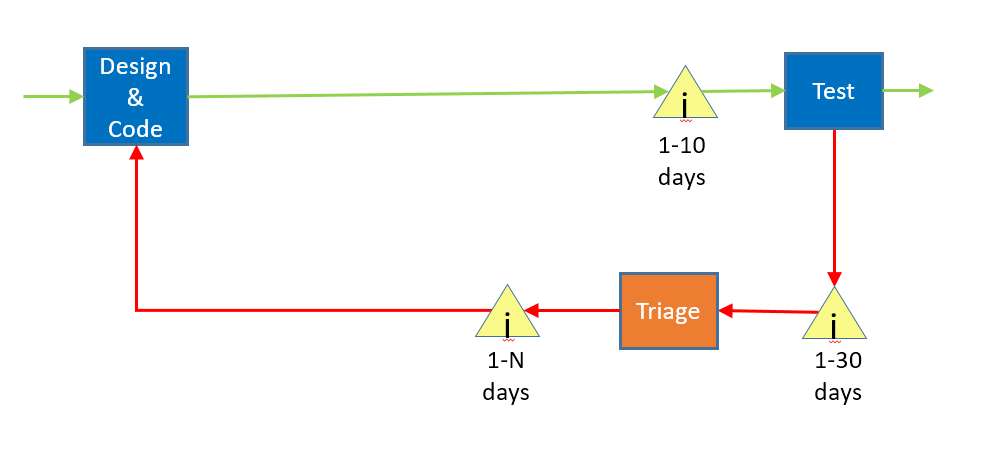
Not only is there a queue before test, there are queues on the output of test. The first queue sits before the triage process, where we spend time talking about how bad each bug is and whether we want to expend time fixing it. This is typically done by managers and other senior (read as “expensive”, both in monetary terms and opportunity cost terms) people. I put “1-30 days” in front of that as a guess, but in my experience triage happens every week or every few weeks.
After that, bugs move into another queue, which is typically called the “bug backlog”. The reason that the label says “1-N” is that the bug backlog is where many bugs go to die; unless you are fixing bugs faster than you are creating them, this list is going to continue to grow and you therefore will not fix all of the bugs.
I missed another feature of the diagram:
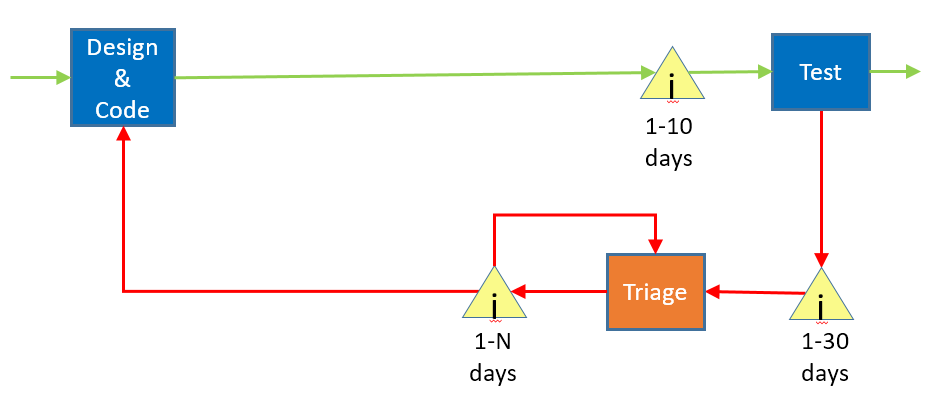
Because bugs come in faster than you fix them, the bug backlog will grow to be too big, so there is often a “retriage” step, where you look at the bugs you already triaged and get rid of the lower-priority bugs. This is an example of rework of the rework.
What can we say about the effect of this on the time it takes a feature to flow through the system? If you agree that a bug is an indication that a feature has not met acceptance, then if you have bugs against that feature you are not done, and therefore most of your features are never done; you may have shipped them, but you are still engaged in rework on them after you ship them.
How did we end up here? Well, this seems like a good time for a story that I call “FeatureLocks and the Three Groups”…
FeatureLocks desperately wanted to go out into the world, but he was held up because he had bugs. He went and talked to the developers, and they said, “FeatureLocks, it’s not our fault, it’s the test team’s job to find bugs, and they are too slow at it”. Then he went and talked to the testers, and they said, “FeatureLocks, we are sorry there are bugs, but we are always busy testing and the developers are just writing too many bugs”. Then he went to the triage group, and they said, “FeatureLocks, we know that you want to go out into the world, but you have 10 priority 1 bugs logged against you and you’ll just have to wait until they are fixed”.
FeatureLocks was so sad. His goal in life was to deliver value, but he couldn’t do that until he worked well and could visit customers.
They did not live happily ever after.
At this point, I feel compelled to talk a bit about charter.
If we want to improve our development process, we need a set of goals. Something like:
- Decreasing the time it takes features to move through the system
- Decreasing the time it takes to fix bugs
- Decreasing the number of bugs
- Identifying more bugs earlier in the process
- Reducing the average bug age
Who owns the charter to make things better?
Upper management certainly owns the overall charter, but they aren’t really close enough to the problem, so they delegate it to the individual team managers. That doesn’t work because each of the group only owns a part of the problem, and the handoff/interactions between groups aren’t really owned by anybody.
Which means we really have two high-level problems; the first is the one we identified in the diagram – we have queues and lots of rework – and the second is that nobody owns the overall problem.
You have probably figured out that this is a long discussion that will lead us towards what is sometime called “combined engineering”. We take the dev and test teams and we combine them into a larger “engineering” team. What do we get out of this?
- Since we don’t have a handoff between teams, our queue between coding and testing will be smaller. More importantly, the way that process works is owned by one team, which means they can improve it.
- It is in the new team’s best interest to make bugs easier to find and fix.
My experience is that combined engineering is a significant improvement over individual teams.
There is a natural extension to combining dev and test; the “devops” movement includes operations functions such as deployment into the same team, and has the same sort of benefits.
The meta point – which I stole directly from the Theory of Constraints – is to always look at the interfaces between teams, because those are places where inefficiencies naturally accumulate.
That pretty much covers the bottom part of the diagram; in my next post I’ll be tacking the design / code part.
Recent Comments